
Monitoring airborne emissions is becoming more accurate
When Matti Irjala was a child and driven in his parents’ car through Finland to visit family, his mum or dad would turn on the cabin air recirculation as they passed through certain towns. The foul odour of hydrogen sulphide (H2S) and other compounds surrounded some industrial centres, and the compounds that caused them in the air were not good for health.
Today, when Dr Matti Irjala, now Director of Research and Development at Aeromon, drives his car through the same town, he does not worry about protecting his children from the air around them. Industrial plants monitor emissions more closely than in the past, and the government more strictly regulate chemical compounds that can be emitted into the atmosphere. Companies like Aeromon that can better help industrial companies monitor what harmful chemicals are emitted from industrial sites have also emerged.
Aeromon now monitors a wide range of airborne emissions, including gas components, particulates and noise. Many substances need to be monitored, as odours, for example, are rarely caused by a single compound.
“We started by measuring the gas components produced by combustion processes. We have since expanded to include the study of malodorous and greenhouse gases, depending on customer needs. Today, we are also looking for other industrial chemicals in the air, such as gases used in refrigeration”, says Irjala.

Fast-growing interest in methane and other VOCs
Traditional compounds regulated and monitored include sulphur dioxide (SO₂) and nitrogen oxides (NOₓ), which can cause land and water to become acidic, as well as ammonia (NH₃), which is toxic and can simultaneously lead to acidification and eutrophication of the soil.
The need to slow global warming has expanded client interests beyond the regulatory minimum of monitoring: all relevant greenhouse gas (GHG) compounds – carbon dioxide (CO₂), methane (CH₄) and nitrous oxide (N₂O, colloquially also called laughing gas) – are being monitored and controlled. The focus is already on CO₂ and CH₄, and now eyes are turning toward N₂O because, despite much lower global emissions than CO₂ or CH₄, N₂O is a significantly more potent greenhouse gas.

VOCs include a wide range of chemicals
A list of VOCs in our air is extensive and includes aromatic hydrocarbons such as benzene, and chlorinated hydrocarbons such as DDT and PCBs. VOCs also include alcohols, glycols, and esters, which give rise to many of the fragrances from flowers and fruit.
Many VOC emissions are harmless, but others are not only harmful but are dangerous; they can accumulate in the body and lead to illness, such as cancer. VOCs contribute to smog by forming ground-level ozone upon reaction with nitrogen oxides in sunlight. Because VOCs are soluble in water, they can also threaten groundwater quality.
A large proportion of VOC emissions come from unburned fuel residues from vehicles, while another major source is chemical solvents. This is why, for example, petrol stations and paint factories in EU countries are required to report VOC emissions annually.
Analysing the results requires complex data aggregation
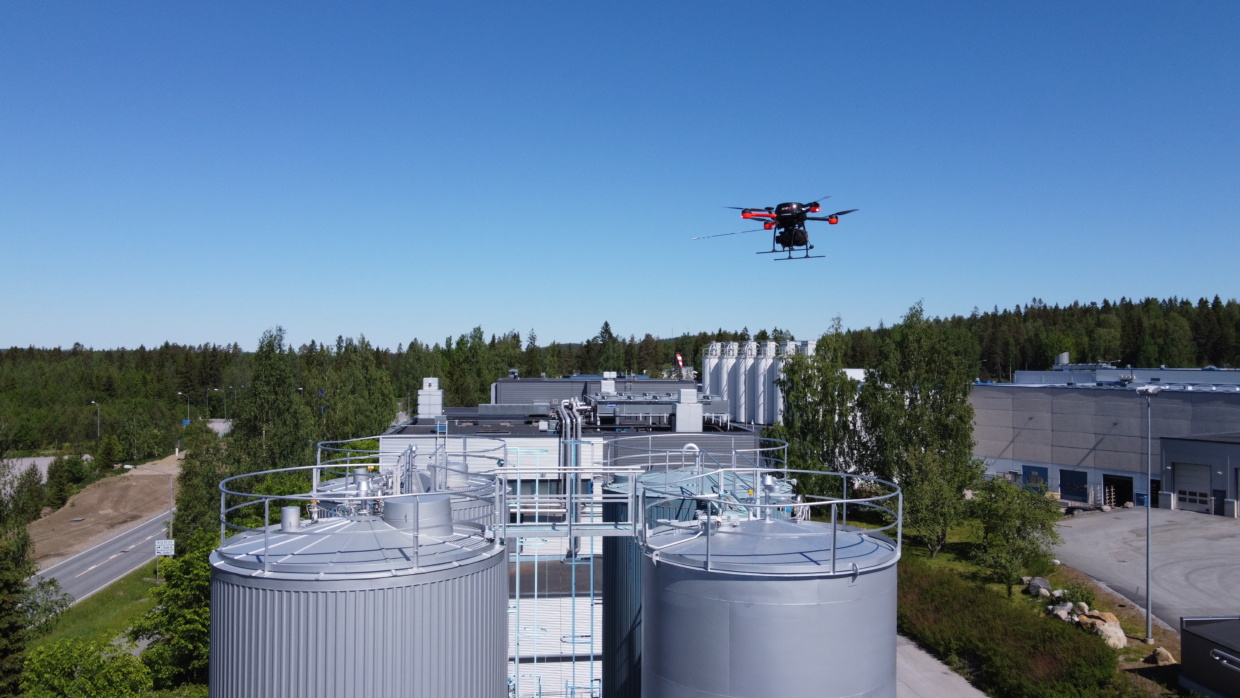
New gaseous compounds can be monitored continuously as Aeromon has the capability to rapidly integrate new sensors into its BH-12 measuring platform as required.
“We have built a generic interface where different sensors can be combined. A key part of our work is analysing the data from the sensors.”
Almost all small sensors that are designed to detect VOC’s or odorous compounds are saddled with a large array of cross sensitivities, which means that the sensors react to several compounds, not only to the target compound. This makes data analysis challenging.
“We solve the problem by including several sensors that react to the monitored compound in the measurement situation. However, they react differently to compounds other than the compound monitored. By comparing results from different sensors, Aeromon’s algorithm can more accurately determine the presence of the compound of interest,” says Irjala.

Usually approximately 1-5 compounds are measured at a time
Clients usually want to measure 1–5 compounds at a time. However, according to Irjala, the maximum number of compounds that can be measured on a single flight is perhaps 15–20, depending on the sensors selected.
Irjala stresses the importance of knowing the airflow. The aim is to take measurements in ideal wind conditions, but small turbulences — rapid changes in airflow speed and direction — always affect the results. In addition, chemicals from the same leak can behave differently in the air because of their weight.
“Understanding the results of weather measurements is also part of Aeromon’s core competence,” explains Irjala

PID, NDIR and TDLAS sensor development improves monitoring
Different sensors are used to measure different compounds. They are currently developing rapidly.
According to Irjala, photoionisation detectors (PIDs) can be used to measure VOCs. In a PID, high-energy photons scatter molecules into positively charged ions. The ions produce an electric current which forms the detector’s signal source. The higher the VOC concentration, the more ions are produced and the higher the current.
A PID is an efficient and inexpensive detector that can identify the presence of multiple gases and vapours. PID detectors provide instantaneous readings, operate continuously, and are commonly used in handheld portable instruments.
Similarly, a nondispersive infrared (NDIR) sensor or a sensor using tunable diode laser absorption spectroscopy (TDLAS) is commonly used for measuring, among other components, ammonia, nitrous oxide and methane.
Both NDIR spectroscopy and TDLAS are based on the absorption of light in a specific wavelength in the presence of a target gas. These detection technologies consist of a light source, detector and an optical cavity where the sample gas is exposed to the light. The magnitude of the absorption in a gas-specific wavelength is transformed into a concentration.
“The miniaturisation of these technologies has helped us enormously to measure the components accurately. Now these sensors’ weight, performance and reliability enable the reliable data collection that we are always looking for,” says Irjala.
Read more about our services!

Emission Mapping
Actionable information on fugitive emission locations, sources, and concentration levels
Mapping out fugitive emissions is a great way to start getting to know your surroundings. It gives a clear picture of where the biggest pollution points and their concentration levels are at that specific point of time. With this “treasure map” it’s easy to go dig deeper and find out more of those sources, their severity and exact location. It’s a tool for the whole company from maintenance to operations and environmental aspects to back investment decisions.
Interested? Read more on our Emission Mapping page.

Dilution & Spreading
Visualised, layered information on the emission dispersion of various compounds
A knowledge of emission dispersion allows you to better understand the impact emissions and odours have on your surroundings. We perform the emission fenceline measurements downwind from the source at multiple altitudes and distances to give assessed data points in three dimensions. The incoming pollution is recorded with reference fenceline measurements directly upwind from the found sources.
Interested? Read more on our Dilution & Spreading page.